참고사이트
Beats 다운로드: Elasticsearch를 위한 데이터 수집기 | Elastic
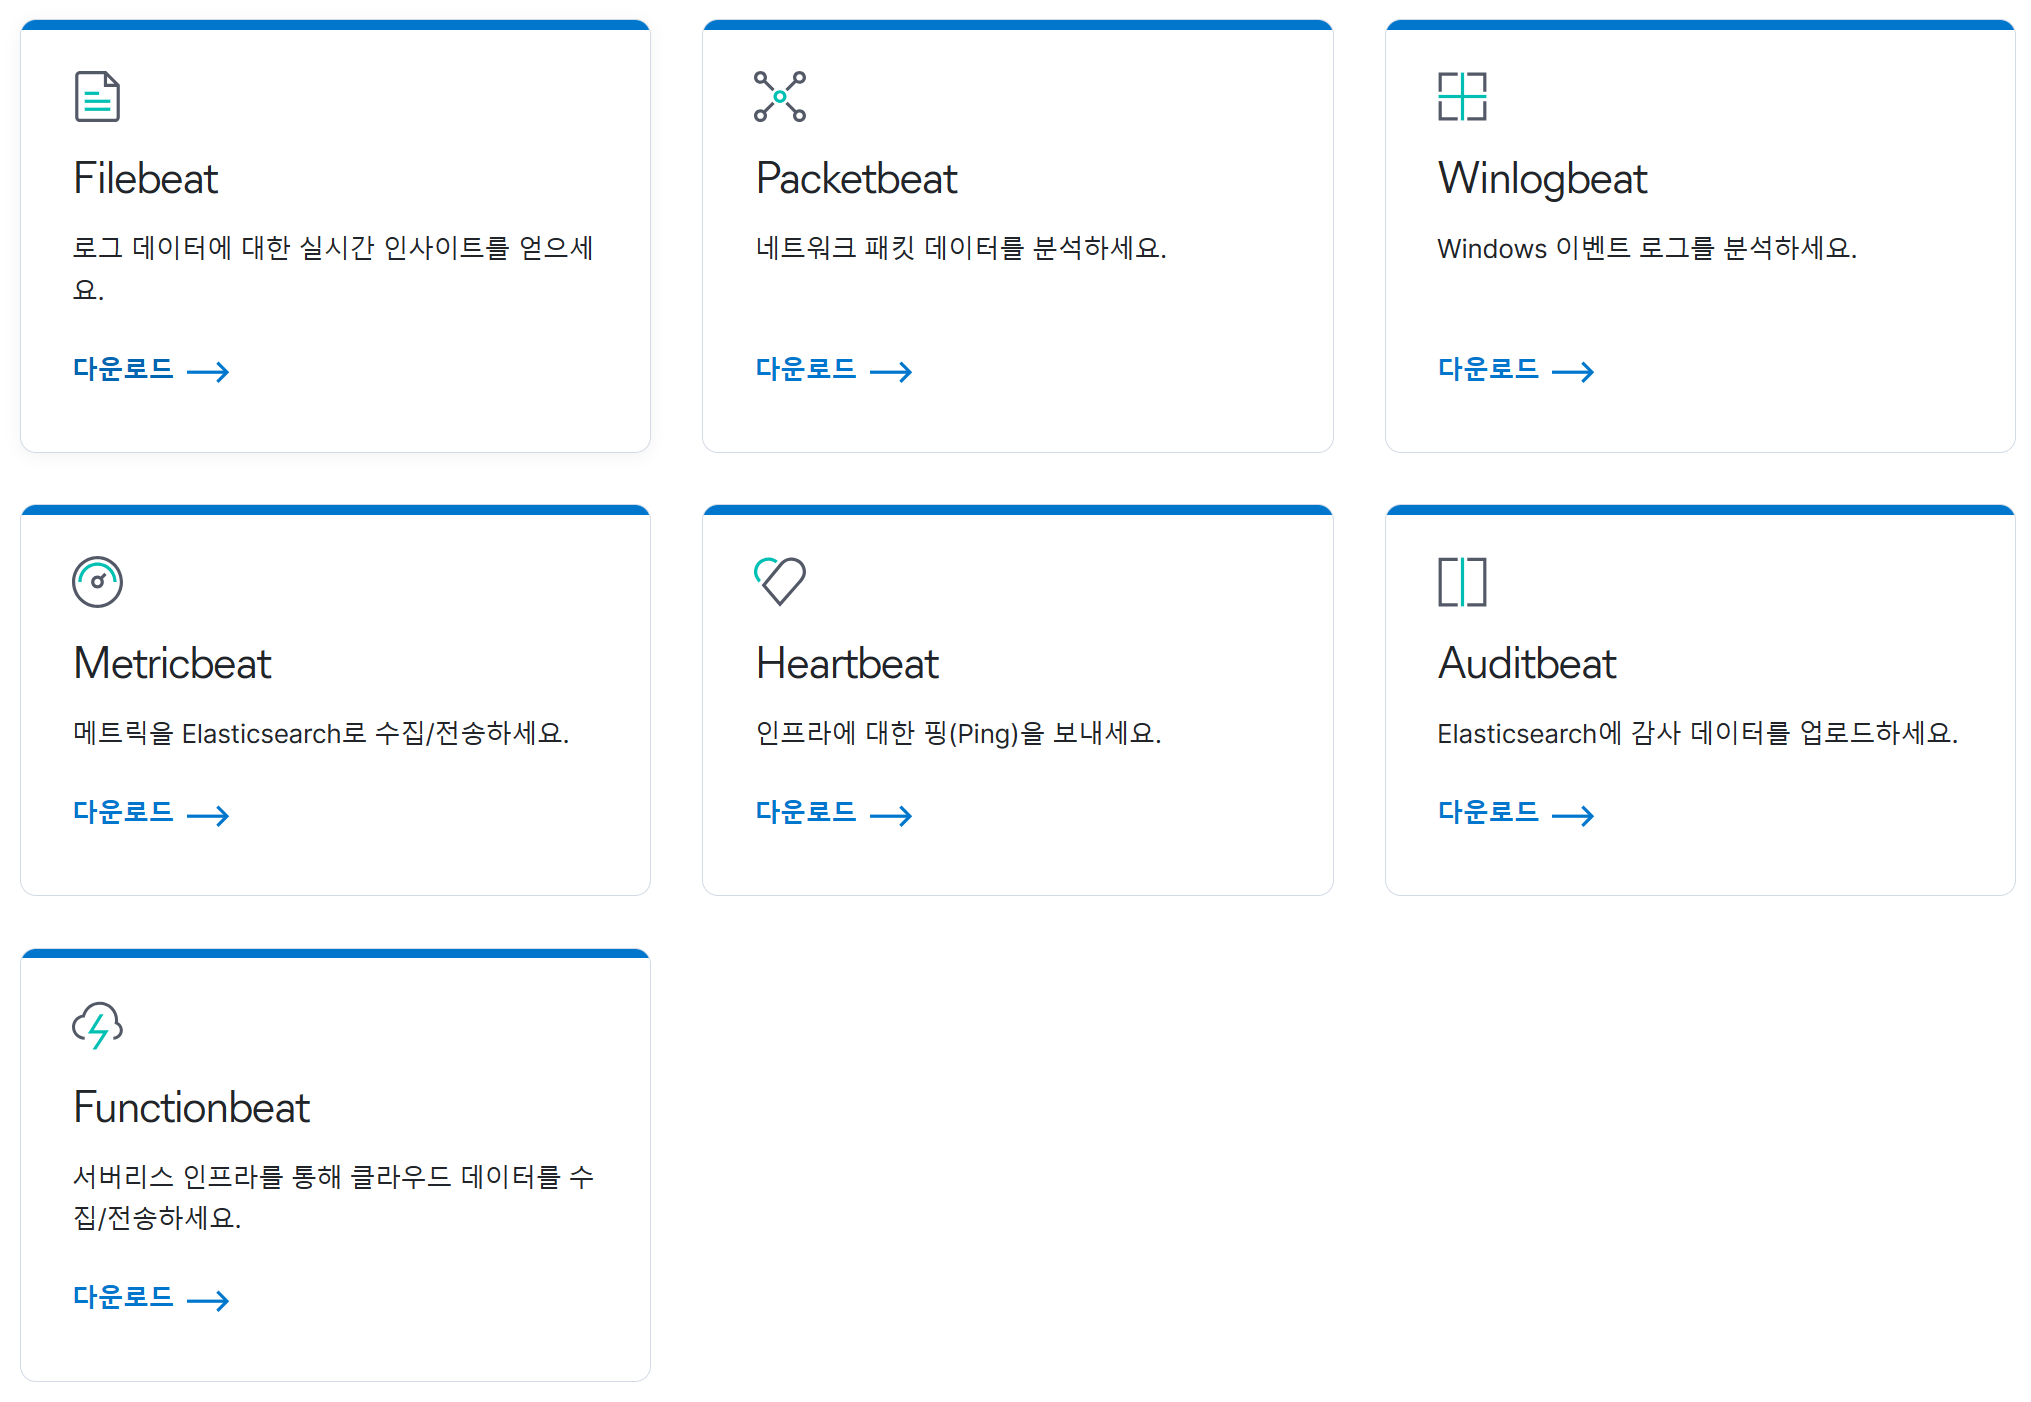
Beats 다운로드: Elasticsearch를 위한 데이터 수집기
Elastic Stack용 경량 데이터 수집기인 Beats를 사용하여 데이터를 Elasticsearch로 손쉽게 수집하고 로그 파일, CPU 메트릭, 네트워크 데이터 등을 처리하세요.
www.elastic.co
| 기능 | Elastic Agent | Beats | Logstash |
| 데이터 수집 역할 | 다양한 데이터 소스에서 데이터 수집 및 전송 | 다양한 데이터 소스에서 데이터 수집 및 전송 | 다양한 데이터 소스에서 데이터 수집 및 전송 |
| 플러그인 지원 | 모듈 기반 플러그인 지원 | 다양한 모듈 및 출력 플러그인 지원 | 다양한 입력 및 출력 플러그인 지원 |
| 구성 및 관리 | Kibana 또는 Elastic Cloud에서 중앙 집중식 구성 및 관리 | YAML 설정 파일을 사용하여 로컬 구성 | 설정 파일 기반의 로컬 구성 |
| 경량화 | 상대적으로 무겁고 리소스 사용량이 큼 | 경량이며 리소스 사용량이 적음 | 중간 정도의 리소스 사용량 |
| 파이프라인 도구 | 내장 파이프라인 기능을 갖춤 | 파이프라인 기능이 부족함 | 파이프라인을 강력하게 지원함 |
| 필터링 및 변환 | 제한적인 필터링 및 변환 옵션 | 다양한 필터링 및 변환 옵션 지원 | 강력한 필터링 및 변환 옵션 지원 |
| 스케일링 및 확장성 | 자동 스케일링 및 확장성 지원 | 수동 확장성, 추가 구성 필요 | 수동 확장성, 추가 구성 필요 |
Filebeat
Filebeat는 로그 파일, 텍스트 파일 등의 파일에서 데이터를 수집하는데 사용됩니다. 예를 들어, 웹 서버 로그, 애플리케이션 로그 등을 수집합니다.
https://www.elastic.co/kr/downloads/beats/filebeat
Download Filebeat • Lightweight Log Analysis
Download Filebeat, the open source data shipper for log file data that sends logs to Logstash for enrichment and Elasticsearch for storage and analysis.
www.elastic.co
filebeat.inputs:
- type: log
  paths:
    - /path/to/log/files/*.log
output.elasticsearch:
  hosts: ["your-elasticsearch-host:9200"]
Filebeat 실행
./filebeat -e -c filebeat.yml
Metricbeat
Metricbeat는 시스템 및 서비스의 성능 지표 및 메트릭 데이터를 수집합니다. 예를 들어, CPU 사용률, 메모리 사용량, 데이터베이스 성능 메트릭 등을 수집합니다.
https://www.elastic.co/kr/downloads/beats/metricbeat
Download Metricbeat • Ship Metrics to Elasticsearch | Elastic
Download Metricbeat, the open source tool for shipping metrics from operating systems and services such as Apache web server, Redis, NGINX, and more.
www.elastic.co
metricbeat.modules:
- module: system
  metricsets: ["cpu", "memory", "network", "diskio"]
  enabled: true
output.elasticsearch:
  hosts: ["your-elasticsearch-host:9200"]
Metricbeat 실행
./metricbeat -e -c metricbeat.yml
Packetbeat
Packetbeat는 네트워크 패킷을 모니터링하고 네트워크 트래픽 분석을 위한 데이터를 수집합니다. 예를 들어, 웹 요청, 데이터베이스 쿼리, DNS 요청 등을 추적합니다.
https://www.elastic.co/kr/downloads/beats/packetbeat
Download Packetbeat | Elastic
Download Packetbeat, the open source tool for getting insight into your network data, including protocols like HTTP, DNS, and MySQL, traveling over the wire in real time.
www.elastic.co
packetbeat.interfaces.device: eth0
output.elasticsearch:
  hosts: ["your-elasticsearch-host:9200"]
Packetbeat 실행
./packetbeat -e -c packetbeat.yml
Winlogbeat
Winlogbeat는 Windows 이벤트 로그를 모니터링하고 Elasticsearch 또는 Logstash로 전송하여 Windows 시스템에서 발생하는 로그 데이터를 수집합니다.
https://www.elastic.co/kr/downloads/beats/winlogbeat
Download Winlogbeat | Ship Windows Event Logs | Elastic
Download Winlogbeat, the open source tool for shipping Windows event logs to Elasticsearch to get insight into your system, application, and security information.
www.elastic.co
winlogbeat.event_logs:
  - name: Application
  - name: Security
  - name: System
output.elasticsearch:
  hosts: ["your-elasticsearch-host:9200"]
Winlogbeat 실행
.\winlogbeat.exe -e -c winlogbeat.yml
Heartbeat
Heartbeat는 서비스 및 웹 사이트의 가용성을 모니터링하고 Elasticsearch 또는 Logstash로 결과를 전송합니다. 주기적인 테스트로 시스템 및 서비스의 가동 상태를 확인할 수 있습니다.
https://www.elastic.co/kr/downloads/beats/heartbeat
Download Heartbeat • Uptime Monitoring & Elasticsearch | Elastic
Download Heartbeat, the open source shipper for monitoring uptime and services using Elasticsearch and Kibana.
www.elastic.co
heartbeat.monitors:
  - type: http
    schedule: "@every 10s"
    urls: ["http://example.com"]
output.elasticsearch:
  hosts: ["your-elasticsearch-host:9200"]
Heartbeat 실행
./heartbeat -e -c heartbeat.yml
Auditbeat
Auditbeat는 Linux 및 macOS 시스템에서 시스템 감사 로그와 보안 이벤트를 수집하고 Elasticsearch 또는 Logstash로 전송합니다. 시스템 보안 모니터링에 사용됩니다.
https://www.elastic.co/kr/downloads/beats/auditbeat
Download Auditbeat
Download Auditbeat, the open source tool for collecting your Linux audit framework data that helps you parse and normalize the messages and monitor the integrity of your files.
www.elastic.co
auditbeat.modules:
  - module: auditd
    backlog_limit: 8196
    rate_limit: 0
output.elasticsearch:
  hosts: ["your-elasticsearch-host:9200"]
Auditbeat 실행
./auditbeat -e -c auditbeat.yml'Elasticsearch' 카테고리의 다른 글
| [LogQL] LogQL 의 다양한 예시 (1) | 2023.11.20 |
|---|---|
| [Elasticsearch] Kibana 에서 다양한 필터 예제 (1) | 2023.10.09 |
| [Elasticsearch] filebeat 명령어에 대한 다양한 예제 (1) | 2023.10.05 |
| [Elasticsearch] grok 의 사용방법 (1) | 2023.10.04 |
| [Elasticsearch] logstash conf 파일 다양한 예제 (1) | 2023.10.03 |